5 Digital Signage CMS Essentials You Shouldn’t Pay Extra For
When selecting a Digital Signage CMS you need to ensure that any add on features and functionality are worth the extra cost
When selecting a Digital Signage CMS you need to ensure that any add on features and functionality are worth the extra cost
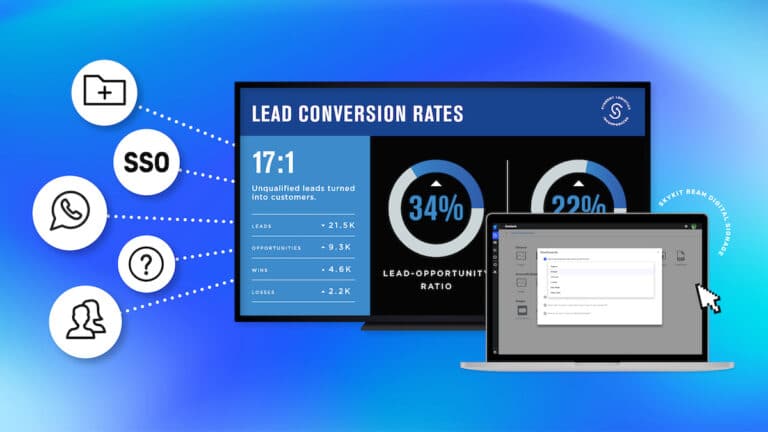
Learn about the authentication issue caused by SSO and how we 8217 ve made it possible to display single sign on dashboards easily and securely
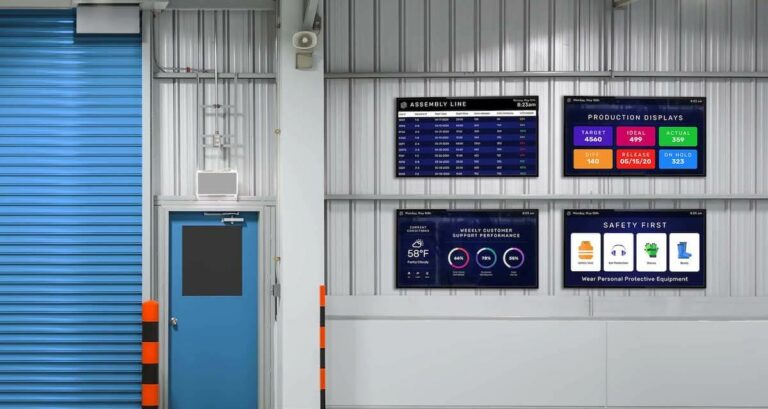
Manufacturing metrics are critical for smart factories Key decision makers rely on up to date data to make decisions that improve the bottom line

Learn how to use digital signage for higher education and ways to meet the demands of communicating relevant information to students and staff in a timely manner
This scenario might be hypothetical, or maybe this is the exact situation you’re facing. You have the data and have created a great dashboard that tells a clear story and helps direct where your company or department should go. Now, you’re looking into using a TV monitor as a display board in your office space so employees can engage with the real-time data. In the past, this could be challenging, as the reach of data visualization tools can be extremely limited, often just to those who have individual access. At Skykit, our customers began asking us critical questions about how to extend the reach of their dashboards. How can they display their dashboards on digital signage or a TV so all employees can see the visualizations? Ultimately, our customers want to increase visibility into the data to help engage employees and encourage them to make smarter decisions. Let’s take a look at three ways in which you can provide visibility into your data and how to effectively use a TV for digital signage. Directly Connect a Computer to a Digital Screen Connecting a computer to a TV is one of the first methods many companies used to operate digital signage.

K 12 education is increasingly more focused on technology Implement digital signage in schools helps meet the needs of your students administrators and staff
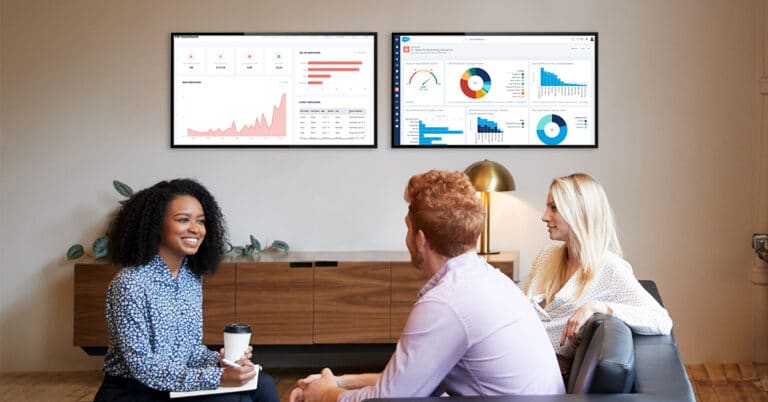
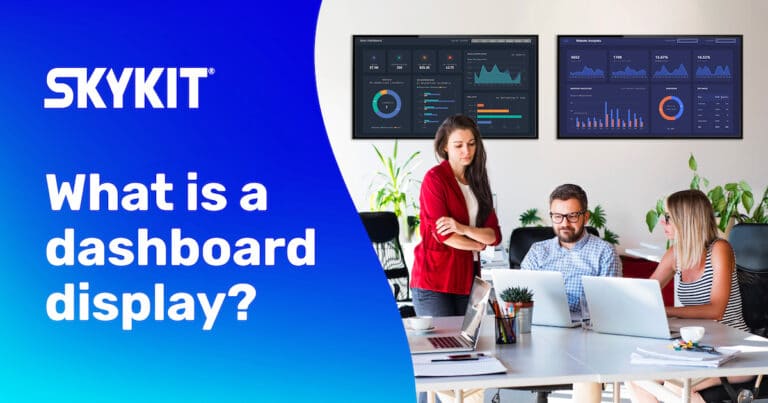
With Skykit Dashboards teams can display their data visualizations or internal data websites on any number of TVs or screens
Skykit Dashboards allow organizations to make data driven decisions by keeping their real time data accessible and secure Connect with a Skykit team member to see how Skykit Dashboards can help you make the most of your data
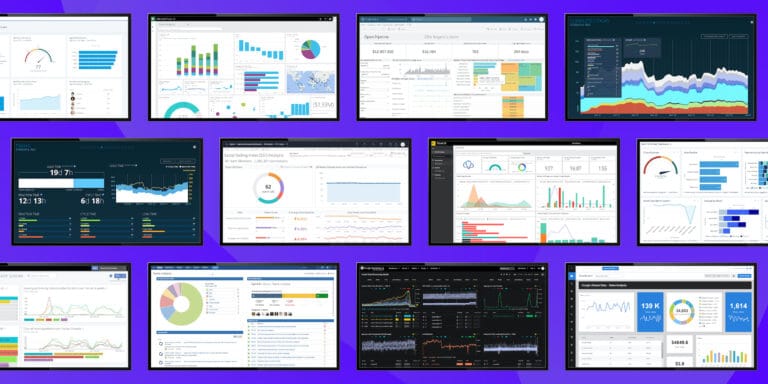
Digital Dashboard Display: Data Visualizations The availability of real-time data in today’s world is astonishing. Top organizations are using real-time data and building data visualizations to interpret the data to help guide the decision-making process. What is data visualization? In essence, data visualization is a way to represent information graphically, highlighting patterns and trends in data and helping the reader to achieve quick insights. (Gartner 2022) Data visualizations can be used for a variety of business purposes across all parts of the organization. Financial results Companies of all sizes have a variety of ways to report financial results. Whether it’s through spreadsheets, simple dashboards, or complex financial reporting, employees are more likely to be engaged if they understand how the company is performing. When financial reports are displayed in real-time, your employees can see the immediate impact of decisions and changes they are making. Consider, for example, when our marketing team invests in a major advertising campaign – we can display their marketing dashboard to watch how the campaign is performing, in real-time. Previously, the marketing team and our leadership team would get updates at a certain point in time. Now, we can truly watch as the campaign works and