Production Floor Visibility
Display real-time production metrics, quality control data, and supply chain information directly on the factory floor
FactBird
Sight Machine
Power BI
Connect 100+ apps and dashboards to share real-time content that informs, engages, and drives action.
All Integrations (0 integrations)

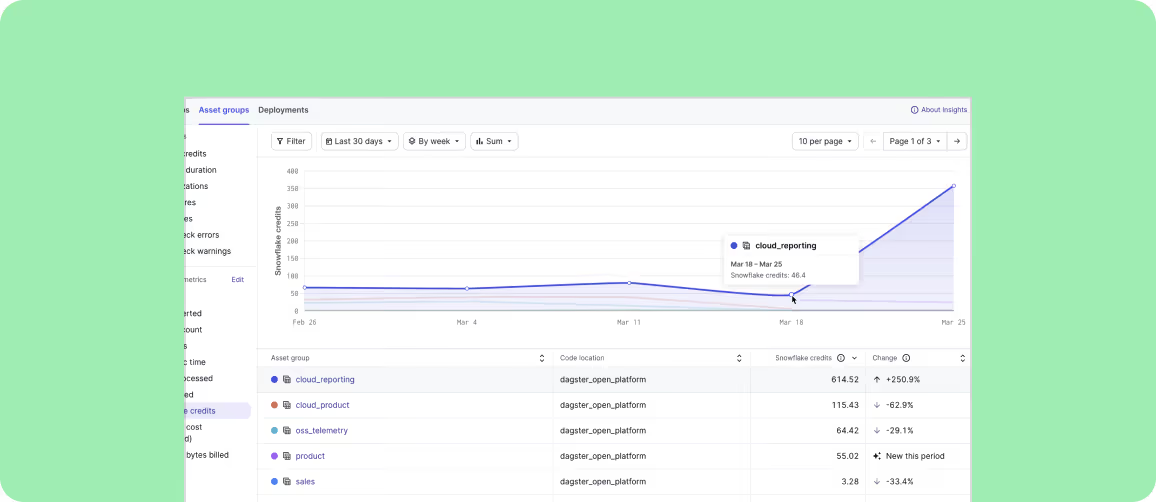
Microsoft's business analytics service for interactive visualizations and business intelligence capabilities
Advanced
Dashboard
Dashboard

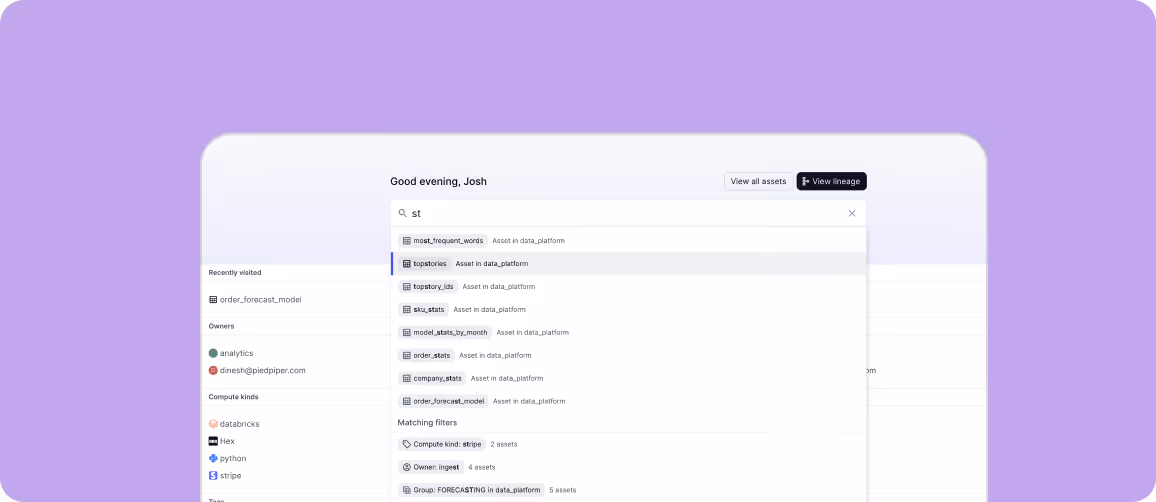
Visual analytics platform for data-driven decision making and interactive dashboards
Advanced
Dashboard
Dashboard
Modern business intelligence and data analytics platform for exploring and sharing insights
Advanced
Dashboard
Dashboard

End-to-end data integration and analytics platform for business intelligence
Advanced
Dashboard
Dashboard

Business intelligence software for complex data analysis and embedded analytics
Advanced
Dashboard
Dashboard

Cloud-based business intelligence platform for real-time data visualization
Advanced
Dashboard
Dashboard

Simple dashboard tool for visualizing key metrics and KPIs in real-time
Standard
Dashboard
Dashboard

Cloud-native analytics platform for exploring and visualizing data
Advanced
Dashboard
Dashboard

Google's free data visualization tool for creating interactive dashboards and reports
Advanced
Ads
Ads

Instantly share up-to-date 36-hour weather forecasts on your screens to help everyone plan ahead with confidence.
Standard
Weather
Weather

Display a rolling 5-day weather outlook to keep your team and visitors prepared for the week ahead.
Standard
Weather
Weather
.webp)
Showcase real-time airplane schedules and operational data to streamline airport or fleet coordination.
Advanced
Dashboard
Dashboard

Show current weather conditions with automatic updates, helping everyone dress appropriately and plan their day.
Standard
Weather
Weather

Keep everyone informed with up-to-the-hour weather forecasts, perfect for planning daily activities.
Standard
Weather
Weather

Display live animated weather radar maps to keep your audience informed of current and approaching weather conditions.
Standard
Weather
Weather

Visualize application performance metrics and alerts to quickly identify and resolve issues, keeping your systems running smoothly.
Advanced
Dashboard
Dashboard

Bring live factory performance data to your screens, enabling teams to monitor production and react to changes instantly.
Advanced
Dashboard
Dashboard

Surface manufacturing analytics and factory floor insights to drive efficiency and transparency across your operations.
Advanced
Dashboard
Dashboard

Keep teams aligned by displaying Asana project tasks and progress, boosting productivity and accountability.
Advanced
Dashboard
Dashboard

Stream live security camera feeds and alerts to central screens for enhanced workplace safety and awareness.
Advanced
Dashboard
Dashboard

Present critical CAPS system analytics to your team, supporting informed decisions and operational excellence.
Advanced
Dashboard
Dashboard
Monitor infrastructure and application health in real time, so your IT team can act fast and prevent downtime.
Advanced
Dashboard
Dashboard
Display vital Distributed Control Systems (DCS) data to keep your operations team informed and responsive.
Advanced
Dashboard
Dashboard

Highlight application and infrastructure performance with live Dynatrace dashboards, enabling proactive issue resolution.
Advanced
Dashboard
Dashboard


INTEGRATIONS
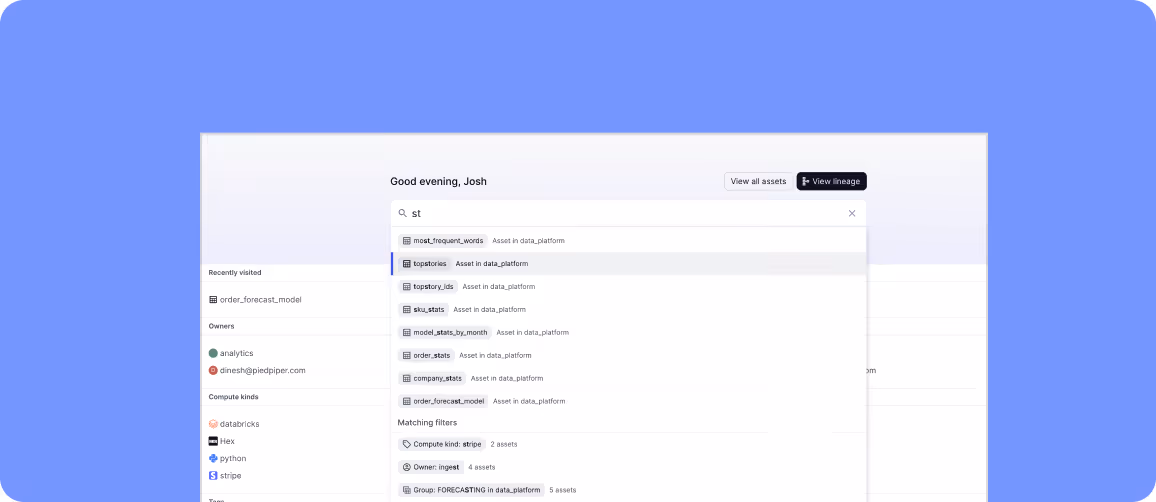
Bridge the gap between where your data lives and where decisions get made.
Incredible insights are often trapped behind individual desktop logins. Without integrations, teams resort to manual workarounds—spending 10-20 hours a week just taking and sharing screenshots. Integrations break down these silos by automating data delivery, ensuring everyone sees the same KPIs and goals without the manual effort.
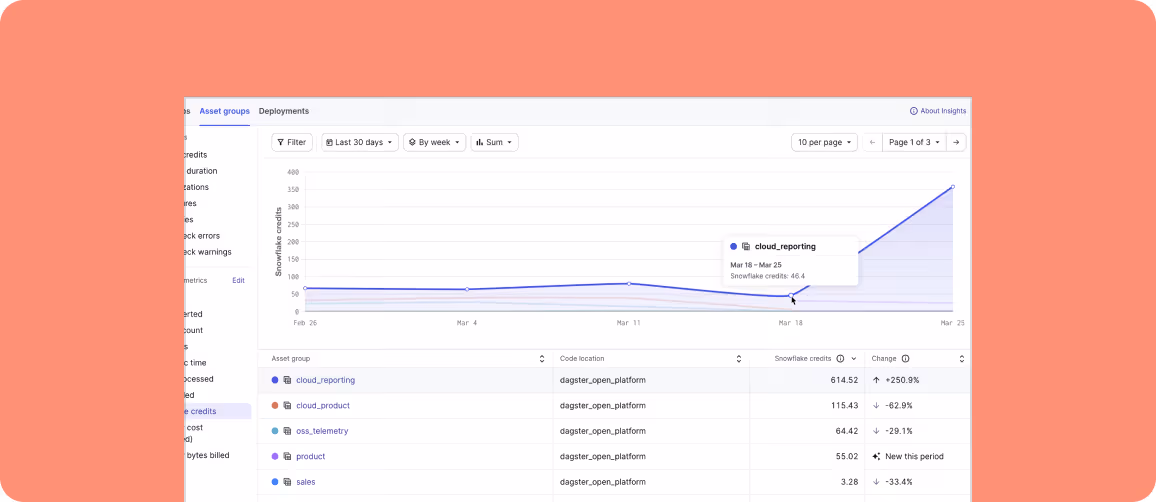
When there's a gap between where your data lives and where your frontline teams operate, response times suffer. Automated integrations ensure your dashboards refresh in near real-time, allowing your team to spot anomalies quickly, address issues instantly, and turn invisible data into immediate, confident action.
A fragmented tech stack means your workforce isn't operating from a unified view. By securely connecting tools like Power BI, Tableau, and Salesforce directly to your digital displays, you bring existing data investments to life. This shared visibility fosters natural accountability, boosts team morale, and keeps your entire organization aligned.
Display real-time production metrics, quality control data, and supply chain information directly on the factory floor
Track shipping statuses, fleet locations, and delivery metrics in warehouses and distribution centers
Maintain visibility on sales metrics, customer engagement, and
campaign effectiveness across all locations
Monitor system performance, network status, security alerts, and incident response times in real-time
"In our ICU, we have a very large Tableau dashboard, and people are able to interact with it by scrolling up and down. It's really a great experience. Using Skykit with SharePoint has also helped us cut down on errors.”


See why organizations choose Skykit to power their digital signage operations.


Our team can help you connect your technology stack


.svg)


