

Somewhere in your organization right now, a decision is being made without the data that would have changed it.
The data exists. Someone built the dashboard. Someone cleaned the inputs. Power BI, Tableau, a custom tool - it's all there, and it's beautiful, and leadership checks it every Monday.
But the person actually making the call this afternoon? They're twenty feet away from a laptop they don't have open, on a floor where no one has screen access. The dashboard might as well not exist.
That's the gap. And it's the one Amanda Makulec - author of Dashboards That Deliver - and I spent an hour unpacking during our recent live session. Not because closing it requires rebuilding your tech stack. It doesn't. It requires asking a better question up front.
Not, "What dashboards do we have?"
But rather, "Who needs this information, and where are they when they need it?"
Start there, and everything downstream gets easier.
Watch Amanda on finding the gap between where data lives and where decisions get made →
The missing audience isn't in the boardroom
Most companies planning a dashboard rollout think about executives. Leadership. The people already swimming in data.
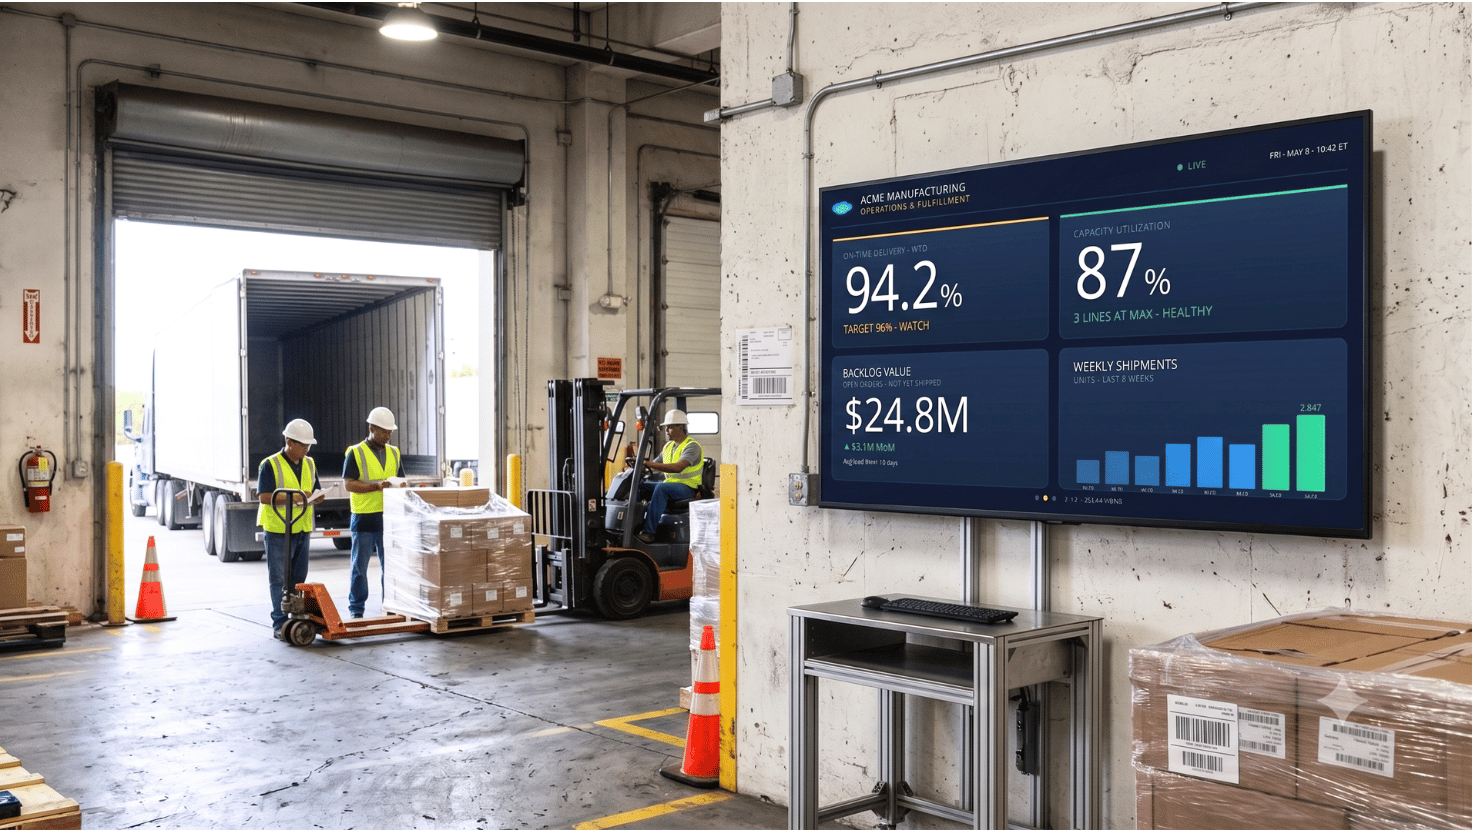
The person making the decision I opened this piece with? Usually isn't one of them. They're on the plant floor. They're in the logistics center. They're behind the service desk triaging a spike in call volume. And the cost of leaving them without real-time data shows up on the P&L - every shift.
A few patterns I've watched repeat across our customer base. A manufacturing team went from resolving production incidents in hours to resolving them in minutes - not because we gave them new data, but because we put the data they already had onto the floor. A contact center saw CSAT and agent morale both tick up when SLA metrics moved from the supervisor's monitor to every agent's line of sight. An operations team reclaimed 10–20 hours per location per week by killing the manual screenshot-to-slide workflow that used to feed their lobby screens.
The data was already there. It just wasn't where the people were.
This is the reframe Amanda has been pushing for years, and the one I keep coming back to: dashboards don't exist to be viewed. They exist to drive action. A dashboard that lives on a laptop while the people who need it are somewhere else is an exploration tool - not an action driver.
What changes when a dashboard leaves the laptop
The instinct is to take the dashboard as-is, cast it to a screen, call it done. Same layout. Same metrics. Same fonts. But what reads perfectly at eighteen inches becomes a smudge at twenty feet. Numbers get lost. Hierarchy collapses. The color palette that made sense on your monitor turns into a muddle on the wall.
Amanda's design principles - the ones worth carrying into every dashboard-to-display conversation:
- Design for the distance. Your audience is ten to thirty feet away, not eighteen inches. Every design decision (font size, contrast, metric density) has to account for that. If you can't read it from across the room, neither can your frontline team.
- Hierarchy beats completeness. The eye lands in the upper-left of a screen and moves down in a Z-pattern. Put your two or three most decision-driving metrics there. Resist the urge to cram. A screen with five things that matter will outperform a screen with thirty things someone might want to see.
- Color is a signal, not a style choice. Use it to flag what's slipping, what's on fire, what's working well. One note worth repeating: red/green (the default in most alerting dashboards) is the hardest combo for people with color vision deficiency. Design for accessibility from the start, not as a retrofit.
- Give the eye somewhere to rest. Cluttered screens get tuned out. White space (or dark space, if you're in dark mode) lets the important stuff land.
- Test on the real screen. Early. You will be shocked at what breaks when your dashboard hits a 55" display at the end of a warehouse aisle. Catching that at the mockup stage is a thirty-minute fix. Catching it after deployment is a project.
"Is it working?" is the question most teams ask too late
Here's the one I'd argue matters more than any design choice: how will you know this is working?
Most teams default to the easy-to-count stuff - page views, screen uptime, number of integrations deployed. Directionally useful. But as Amanda put it during our session:
"Those metrics tell you the system is running. They don't tell you the system is working."
The story is what changed because of the data.
Watch Amanda on what success actually looks like →
Our customers have got good at this. Some are tracking downtime reduction. Others, mean time to incident resolution, first-time-right quality metrics, onboarding ramp speed, or the recaptured hours from retired screenshot workflows. The specific numbers vary by industry. The shape of the conversation doesn't.
And those are the numbers that make the case to your CFO. Worth defining before launch - not after you're trying to justify the renewal.
Where to start when your team and budget aren't unlimited
The best question we got during the live session came from someone with a small team: how do I prioritize?
Simpler than it sounds: start with your highest-stakes use case.
Not the most complex. Not the one with the most integrations. The one where someone is most disadvantaged by not having real-time information. Where the absence of data is actively costing you — in time, in quality, in response speed, in morale.
Start there. Prove the value. Expand from that foothold.
And one reassurance for teams who hear "dashboards on screens" and assume they're starting from scratch: you almost certainly aren't. Most organizations already have the dashboards they need - they just haven't been optimized for a different aspect ratio and a different kind of attention. Skykit integrates with 100+ applications, including 70+ BI and dashboard tools, and the most common thing I hear from new customers is some version of: "We already had this data - we just didn't know we could get it onto our screens this easily."
That honestly, is the job.
The real opportunity is bigger than signage
Here's what I keep coming back to.
Every positive touchpoint someone has with data - every time they see a number, understand it, and act on it - builds their confidence in engaging with data the next time. And that confidence compounds.
Putting the right data in front of the right people isn't just a technology decision. It's a decision about who gets to participate in how the business is run. About how fast your organization can move when something shifts: a quality issue, a customer spike, an SLA miss, an opportunity.
That's a bigger conversation than most people expect when they start thinking about "digital signage." But it's the right one to be having.
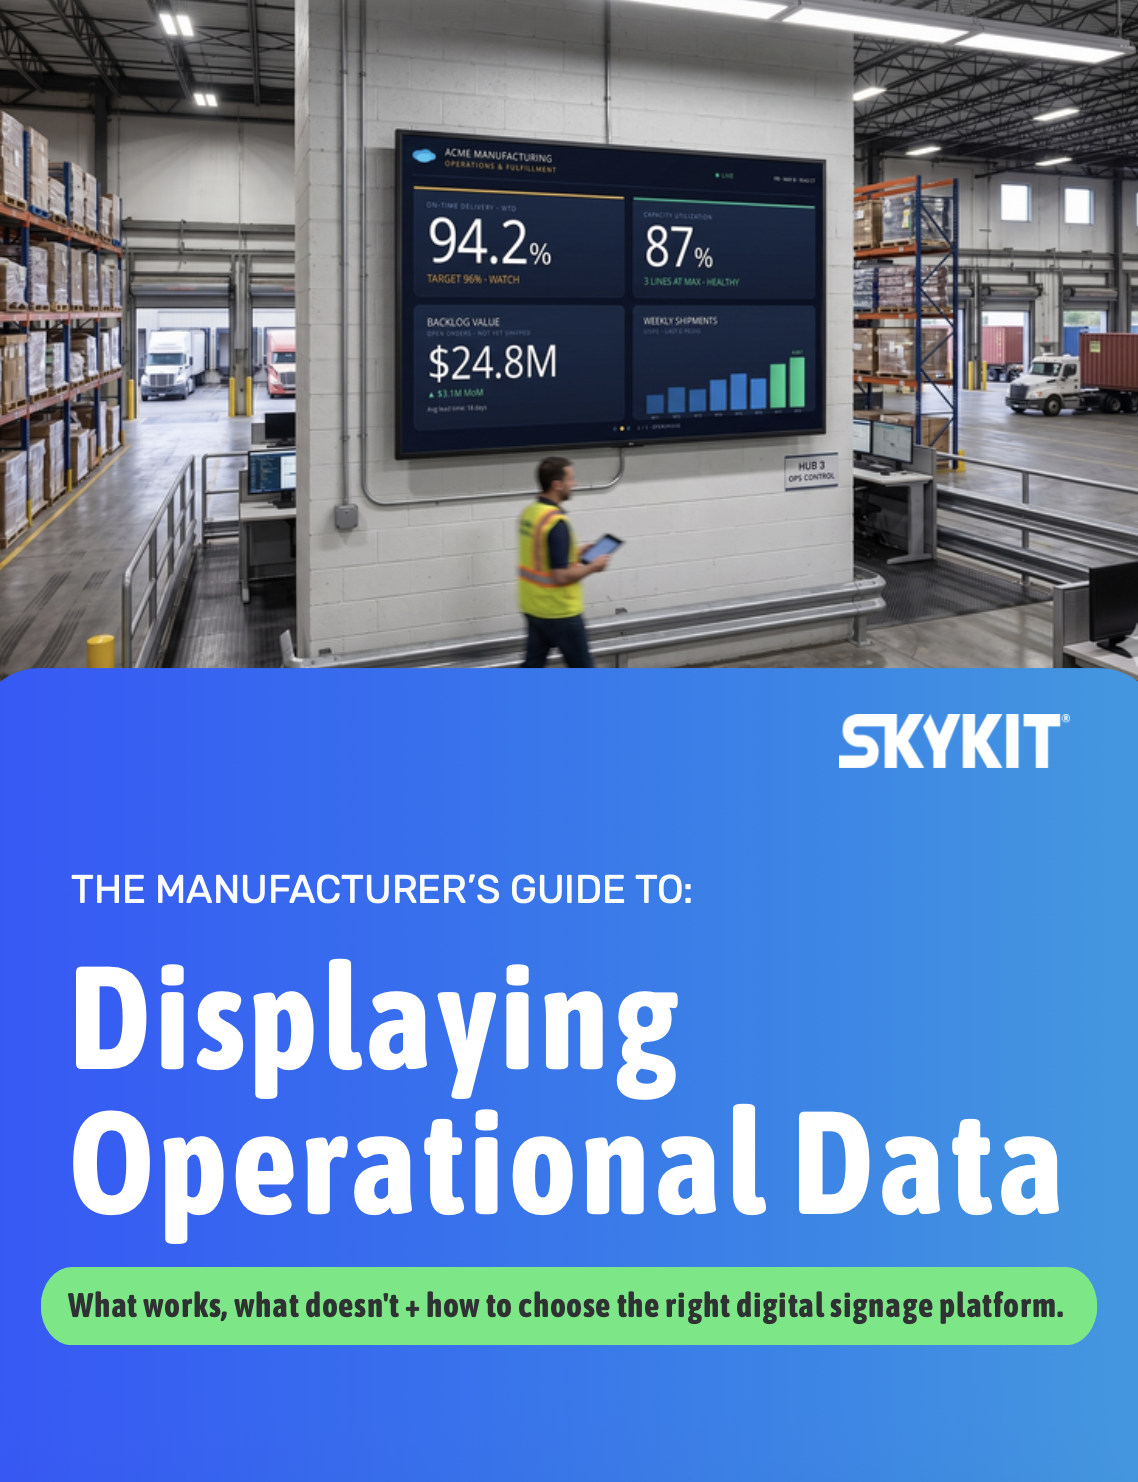
Not sure where your biggest gap is?
Displaying Operational Data: The Complete Evaluation Guide will help you assess your environment and identify where getting data on screens will make an impact.
Lorem ipsum dolor sit amet, consectetur adipiscing elit, sed do eiusmod tempor incididunt ut labore et dolore magna aliqua. Ut enim ad minim veniam, quis nostrud exercitation ullamco laboris nisi ut aliquip ex ea commodo consequat. Duis aute irure dolor in reprehenderit in voluptate velit esse cillum dolore eu fugiat nulla pariatur.


.svg)


