A shareable dashboard is a tool for getting the data and metrics aggregated in one easy place.
By building a sharable dashboard, you help track what you’re working on and if you are reaching your stated goal.
While you might singularly rely on your dashboard to keep you focused on your KPIs, have you ever considered creating a sharable dashboard? One that monitors your and others’ key deliverables? Or, perhaps you want to create a shareable dashboard that monitors your solution’s performance or up-time?
Why Share a Dashboard?
Dashboards, when created well and shared with the right teams, can help drive better decision-making. If you see that a data point is changing and you know why it’s changing, you can make a decision to either lean in more on what you’re doing or reverse course. Imagine what an entire team can do when sharing a dashboard – you have more people focused on understanding something that is either working really well or not working at all.
Create a Shareable Dashboard
As we advise our clients who are looking to build shareable dashboards, we recommend three key steps:
Step 1: Determine who needs to see your dashboard.
This is a critical place to start in determining who will help you align for the next step of what action needs to happen. Remember, as you identify who needs to see and understand data, you may consider sharing a dashboard across multiple groups. Note that each group of people may have a different desired action.
Consider the following groups of people who may need or wish to see your shareable dashboard:
Your fellow team members
Managers within your team or adjacent teams
Executives
Step 2: Determine the goal of sharing a dashboard.
Determining the outcome or action you want to be taken from your dashboard helps you identify what information is needed and how to design the dashboard to drive action. Three goals may be:
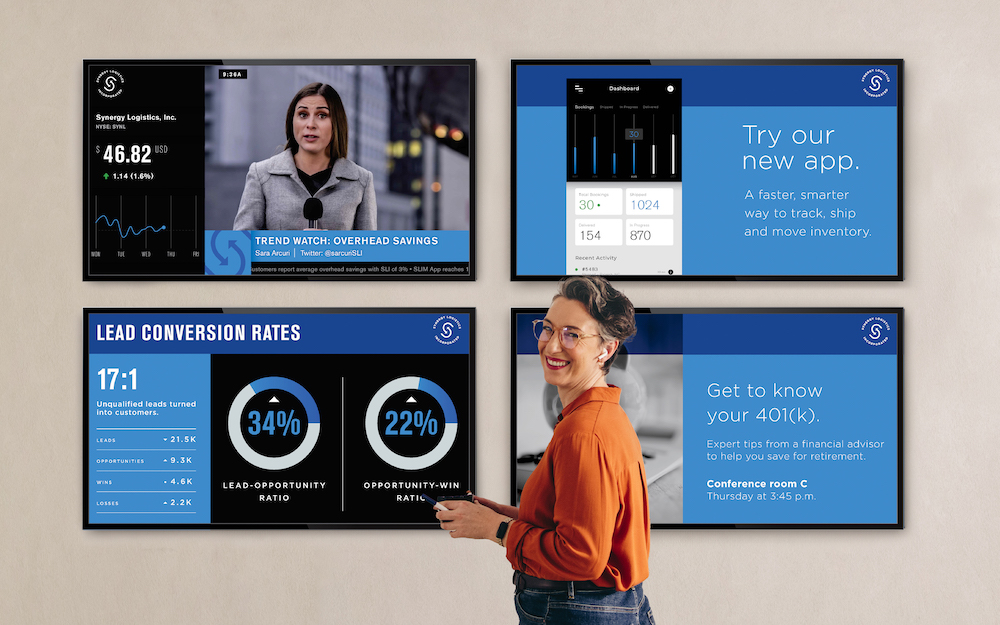
Inform only: Perhaps you want your audience to be aware of the data being collected and tracked from a summary point-of-view. Some informative and shareable dashboard types here may include last quarter’s sales or marketing metrics, website visitors, solution uptime, etc. Informative dashboards are meant to drive awareness and may not have enough detailed information to drive other actions.
Inform to drive strategy: Sharing a dashboard built to drive strategy will likely show data and trends over a period of time. You’ll want to display trends and anomalies that can lead your key audience to engage, ask questions, and drive a new strategic initiative to change the trend lines over a future period of time.
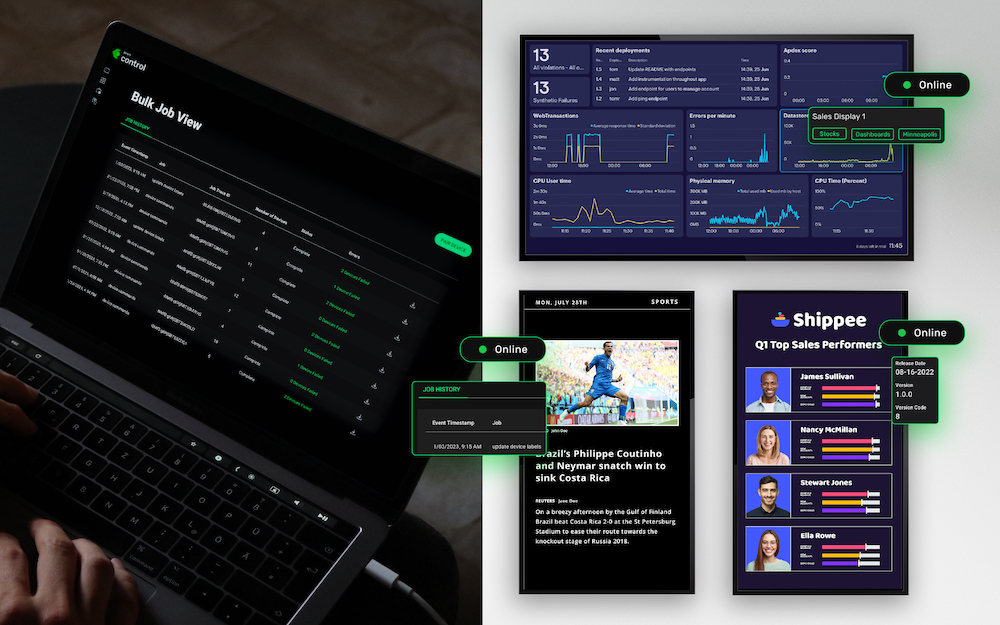
Inform to drive immediate action: Some dashboards are created to drive instant action. These could include leaderboards, real-time activity trackers, or even critical alerts. Imagine if you want to affect immediate change in how quickly support tickets can be resolved; a dashboard can be used that tracks time to resolution and instantly flags tickets that are outside the stated goal. The flag should prompt immediate action to resolve the issue.
Step 3: Determine the data points will drive the desired action or outcome
Now that you know who you are building your shareable dashboard for and what action you want them to take, you can gather the data points that will be most critical. Remember that when sharing a dashboard, it needs to be easy to digest and monitor; you cannot include every data point you may be tracking.
Review all your data, across all your platforms and determine if you need to aggregate it into one cohesive data visualization tool, like Tableau or Power BI, or if the tools you use have built-in dashboard capabilities, like Datadog, New Relic, HubSpot, or more. Once you have your data gathered, you can begin building your dashboard.
Choose the Right Tool for your Shareable Dashboard
In this recent blog post, we cover the advantages and disadvantages of three key methods:
Connecting an individual computer to each particular display
Screencasting from your device to a Smart TV
Using a cloud-based CMS, like Skykit Beam, to do the heavy lifting
Check out our full list of integrations with data visualization and dashboard tools to easily bring your shareable dashboard to life on digital signage.
Enhance your business with a solid digital signage content strategy. Learn how to set goals, plan content, measure success, and adapt for optimal results.”
This post was inspired by a presentation titled “A Scaling Point of View” by Skykit Co-Founder + CTO Paul Lundberg at DSE 2023. A Scaling Point of View is about the methodologies for constructing a network when scaling is not just an option, but a core requirement.